TABLE 1
Description of Variables and Predictions
|
|
|
|
|
|
|
|
|
|
|
|
|
.27 |
|
|
|
|
|
|
|
|
|
|
|
|
|
|
|
|
|
|
|
.21 |
.40 + |
|
|
|
.26 |
.44 + |
|
|
|
.27 |
.45 + |
|
|
|
.14 |
.35 + |
|
|
|
12.84 |
|
|
|
|
29.69 |
17.10 + |
|
|
|
8,657 |
10,557 + |
|
|
|
.45 |
.50 + |
|
|
|
.04 |
.19 + |
|
|
|
.48 |
.50 + |
|
|
|
27.46 |
|
|
|
|
.80 |
.40 + |
|
|
|
.42 |
.49 + |
|
|
|
.01 |
.08 + |
|
|
|
472,687 |
499,073 + |
|
|
|
53.84 |
11.01 + |
|
|
|
1,508 |
|
|
|
|
.14 |
.35 + |
|
|
|
.08 |
.27 + |
|
|
|
2,964 |
2,771 + |
|
|
|
.23 |
.42 + |
|
|
|
.08 |
.27 + |
TABLE 2
the 1970-1974 Cohort of Immigrants, Untied States, 1980
|
|
|
|
|
|
|
|
|
|
|
|
|
|
|
|
|
|
|
|
|
|
|
|
|
|
|
|
|
|
|
|
|
|
|
|
|
|
|
|
|
|
|
|
|
|
|
|
|
|
|
|
|
|
|
|
|
|
|
|
|
|
|
|
|
|
|
|
|
|
|
|
|
|
|
|
|
|
|
|
|
|
|
|
|
|
|
|
|
|
|
|
|
|
|
|
|
|
|
|
|
|
|
|
|
|
|
|
|
|
|
|
|
|
|
|
|
(54,189)
(20,253)
(8,995)
(34,357)
(21,218)
(20,089)
(5,111)
(1,710)
(952)
(20,793)
(43,783)
(17,365)
(1,496)
TABLE 2 (Continued)
|
|
|
|
|
|
|
|
|
|
28.1 |
(34,887) |
|
|
25.9 |
(48,550) |
|
|
|
|
|
|
57.6 |
(552) |
|
|
26.6 |
(82,885) |
|
|
|
|
|
|
25.8 |
(17,862) |
|
|
27.4 |
(45,137) |
|
|
26.4 |
(20,438) |
|
|
|
|
|
|
29.8 |
(4,051) |
|
|
29.2 |
(23,232) |
|
|
32.3 |
(28,666) |
|
|
18.6 |
(27,488) |
|
|
|
|
|
|
31.1 |
(6,599) |
|
|
26.3 |
(55,161) |
|
|
26.7 |
(21,677) |
|
|
|
|
|
|
31.8 |
(11,939) |
|
|
26.0 |
(71,848) |
|
|
|
|
|
|
26.8 |
(6,589) |
|
|
26.8 |
(76,848) |
|
|
|
|
|
|
19.1 |
(33,192) |
|
|
25.7 |
(25,544) |
|
|
38.3 |
(24,701) |
|
|
|
|
|
|
31.5 |
(19,605) |
|
|
25.3 |
(63,832) |
|
|
|
|
|
|
30.7 |
(6,385) |
|
|
26.5 |
(77,052) |
TABLE 3
|
|
|
|
|
|
|
|
|
|
|
|
|
|
|
Odds |
|
|
Odds |
|
|
Odds |
|
|
|
|
Ratio |
|
|
Ratio |
|
|
Ratio |
|
|
|
|
|
|
|
|
|
|
|
|
|
|
|
|
|
|
|
|
|
|
|
|
|
|
|
|
|
|
|
|
|
|
|
|
|
1.818 |
|
|
|
|
|
1.723 |
|
|
|
|
3.289 |
|
|
|
|
|
2.943 |
|
|
|
|
3.683 |
|
|
|
|
|
3.384 |
|
|
|
|
2.578 |
|
|
|
|
|
3.621 |
|
|
|
|
1.038 |
|
|
|
|
|
1.053 |
|
|
|
|
.999 |
|
|
|
|
|
.998 |
|
|
|
|
1.001 |
|
|
|
|
|
1.001 |
|
|
|
|
1.022 |
|
|
|
|
|
1.020 |
|
|
|
|
1.348 |
|
|
|
|
|
1.294 |
|
|
|
|
1.080 |
|
|
|
|
|
1.046 |
|
|
|
|
.862 |
|
|
|
|
|
.896 |
|
|
|
|
1.029 |
|
|
|
|
|
1.021 |
|
|
|
|
|
|
|
|
|
|
|
|
|
|
|
1.150 |
|
|
|
|
|
1.181 |
|
|
|
|
1.106 |
|
|
|
|
|
1.136 |
|
|
|
|
3.562 |
|
|
|
|
|
3.228 |
|
|
|
|
|
|
|
|
|
|
|
|
|
|
|
(.006) |
1.034 |
|
|
1.077 |
|
|
|
|
|
(.001) |
1.011 |
|
|
1.011 |
|
|
|
|
|
|
(.006) |
.978 |
|
|
.924 |
|
|
|
|
|
|
(.036) |
1.299 |
|
|
1.282 |
|
|
|
|
|
|
(.048) |
1.111 |
|
|
1.146 |
|
|
|
|
(.005) |
1.196 |
|
|
1.162 |
|
|
|
|
|
|
(.021) |
.965 |
|
|
.725 |
|
|
|
|
|
|
(.034) |
.775 |
|
|
.799 |
|
|
|
|
.041 |
|
(.118) |
.077 |
|
|
.008 |
|
|
|
|
|
|
|
|
|
|
|
|
|
|
|
|
|
|
|
|
|
|
|
|
|
|
|
|
|
|
|
|
|
|
|
|
|
|
|
|
|
|
|
|
|
|
|
|
|
|
|
|
|
|
|
|
|
|
|
|
|
|
|
|
|
|
|
|
|
|
|
|
|
|
|
|
|
|
|
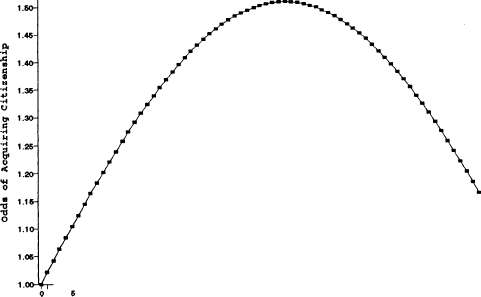
FIGURE II
Revisited," Ethnicity, 7:159-190.
21:390-405.
Migration Review, 22:243-264.
ess," International Migration Review, 15:608-625.